Tag Archives: Passing Rate

Falling National #Average on the #BarExam

10 May

Here are the National average Bar Passage Rates from 2007 – Current day.

  • 2007 ~ 67%
    • February ~ 55%
    • July ~ 73%
  • 2008 ~ 71%
    • February ~ 58%
    • July ~ 76%
  • 2009 ~ 68%
    • February ~ 53%
    • July ~ 74%
  • 2010 ~ 68%
    • February ~ 56%
    • July ~ 73%
  • ​2011 ~ 69%
    • ​February ~ 60%
    • July ~ 73%
  • ​2012 ~ 67%
    • February ~ 55%
    • July ~ 71%
  • ​2013 ~ 68%
    • ​February ~ 58%
    • July ~ 72%
  • 2014 ~ 64%
    • ​February ~ 57%
    • July ~ 67%
  • ​​2015 ~ 59%
    • February ~ 52%
    • July ~ 63%
  • ​2016 ~ 58%
    • February ~ 49%
    • July ~ 62%

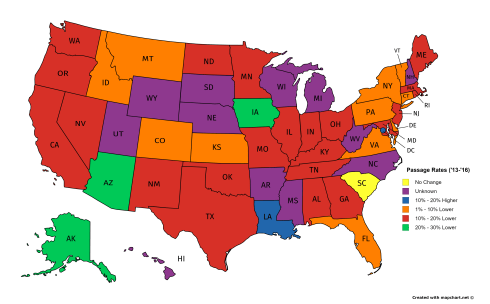
I cant be the only person who thinks it was strange that the national average sat on 67-68% for several years. Nor the only person who finds it questionable that in 3 years, it suddenly dropped 10%. Something is wrong, and it cannot just be the students level.

I cannot count a lot of the states (they don’t say how many students sat and passed), but for the 19 states I could count for February 2017 the average was 50.01%.

Bar Exam Passage Rates (July 2015 and July 2016)

19 Nov
passage-rates-13-16

July 2016 Results Compared to July 2013

The following Statistics are Comparing July 2016 to July 2015

Alabama (58.4% – down 1.6%)
Alaska (45% – down 15%)
Arizona (53% – down 4%)
Arkansas (Unknown)
California (43% – down 3%)
Colorado (73% – up 1%)
Connecticut (69% – down 6%)
Delaware (66% – Same)
DC (62% – up 18%)
Florida (68.2% – up 6.2%)
Georgia (65.8% – down 2.2%)
Hawaii (Unknown)
Idaho (72.5% – up 4.2%)
Illinois (72% – Fall 0f 4%)
Indiana (61% – down 13%)
Iowa (71% – down 15%)
Kansas (78% – up 3%)
Kentucky (65% – down 6%)
Louisiana (64.9% – up 3.1%)
Maine (Unknown)
Maryland (63% – Same)
Massachusetts (70.8% – down 1%)
Michigan (Unknown)
Minnesota (73.22% – down 4.3%)
Mississippi (Unknown)
Missouri (79.4% – down 4.6%)
Montana (77% – up 15%)
Nebraska (Unknown)
Nevada (51% – down 9%)
New Hampshire (Unknown)
New Jersey (65.35% – down 5.3%)
New Mexico (62% – down 8%)
New York (64% – up 3%)
North Carolina (Unknown, but believed to have dropped)
North Dakota (63% – Fall of 9%)
Ohio (70.4% – down 4%)
Oklahoma (68% – Same)
Oregon (58% – down 2%)
Pennsylvania (69% – down 2%)
Rhode Island (63% – down 1%)
South Carolina (Unknown)
South Dakota (Unknown)
Tennessee (63% – down 1%)
Texas (70.45% – up 4%)
Utah (Unknown)
Vermont (66% – up 13.6%)
Virginia (73% – up 2%)
Washington (70% – down 6%)
West Virginia (71% – up 2%)
Wisconsin (Unknown)
Wyoming (Unknown)

passage-rates-13-14-1

July 2014 Results compared to July 2013

passage-rates-14-15

July 2015 Results Compared to July 2014

passage-rates-15-16-2

July 2016 Results Compared to July 2015


Bar Exam Statistics Continued

16 Apr

Visit my website here to compare Statistics from February 2013 through February 2016

  • Arkansas –Unknown, Statistics not Shared.
  • Idaho (69.9%) – Steady
  • Illinois – Unknown, Statistics not shared.
  • Indiana (51%) ~ Fall of 16% from Feb. 2015
  • Kansas (50%)Fall of 31.5% from Feb. 2015
  • Kentucky – Unknown, Statistics not yet shared.
  • Missouri (74.3%) – Fall of 3.4% from Feb. 2015
  • Montana (67% including those who have not passed the MPRE, 60% if you don’t include them) – Fall of 7%-14% depending on which number they use from Feb. 2015
  • New Mexico (69%) – Fall of 11% from Feb. 2015
  • North Carolina (26% – if you compare applicant list to passing list) – Fall of 17% from Feb. 2015 unless a bunch of people just haven’t taken the MPRE yet (unlikely, but we’ll hope).
  • Oklahoma (69%) – Rise of 2% from Feb. 2015
  • Oregon (60%) – Fall of 4% from Feb. 2015.
  • Pennsylvania (56.3%) – Rise of 5.7% from Feb. 2015
  • Tennessee (51%) – Fall of 3% from Feb. 2015
  • Vermont (61.3%) – Rose of 15.6%
  • Washington (58.5%) – Fall of 7.2% from Feb. 2015
  • West Virginia (50.4%) – Fall of 17.7% from Feb. 2015

Bar Statistics Start to Fall Again in 2016 (Week 1)

2 Apr

Bar Results are starting to come out and some of the passing rates seem to be falling again!

  • North Carolina (26% – if you compare applicant list to passing list) – Fall of 17% from Feb. 2015 unless a bunch of people just haven’t taken the MPRE yet (unlikely, but we’ll hope).
  • Oklahoma (69%) – Steady
  • Kansas (50%) – Fall of 31.5% from Feb. 2015
  • Illinois – Unknown, Statistics not shared.
  • West Virginia (50.4%) – Fall of 17.7%
%d bloggers like this: