Tag Archives: Bar Exam

Is the UBE easier than other Bar Exams?

30 Jul

Since the Uniform Bar Exam (UBE) was established, several people have asked me whether the UBE is an easier exam to pass — should they wait until the UBE to try taking the exam.

I’ve been rather curious myself, so I started keeping track of the passage rates before and after UBE implementation.

For those of you unfamiliar with the legal practice, each state requires passage of the state bar exam as part of the qualifications for legal certification. Although in the past, each state offered its own unique exam — the UBE is a standardized legal test with scores easily transferred across jurisdictions.

States are not obligated to implement the UBE, and many have chosen to continue using their own exam. Those who do do implement the UBE may also choose to add a state-specific component requirement. But the bar exam itself is more or less consistent across the member states.

The question is whether applicants are finding it easier to pass the UBE than they were the original state exam.

Continue reading

Bar Exam July 2019

30 Jul

💪💪💪Fighting! Don’t stress! Take a breath and remember – you own the bar, it doesn’t own you! Good Luck to all 2019 examinees! #Law #BarExam #Lawyer #LawSchooLGrad #StudyingfortheBar #July2019BarExam

Buy Your Copy Now!

Falling Rate of New Lawyers in the United States (since 2013)

28 Jul

Bar examiners blame the schools. The schools blame the students. The students blame the bar AND the schools.

Whoever bears the responsibility, the facts are clear — each year fewer and fewer lawyer hopefuls are passing the state bar exams. With the bar exam a prerequisite for entry into the legal profession, the consequences are obvious . . . the United States is watching the slow but significant decline in new entrants into the profession.

National Passing Statistics as recorded by the NCBE
Continue reading

February 2019 Bar Results are Coming Out!

5 Apr

Good luck to Everyone!

Image

Some Latin Phrases Use in Law (A-D)

10 Jul

Latin Phrases for Law (A – C.jpg

How Far Has the #BarExam Fallen

25 May

Comparison with February 2013 scores.  ** Please note that all 2017 passage rates are still more or less unofficial. A few states each year will change the rates before the ‘end-of-the-year’ report by the NCBEX because of people who were re-counted, finally passed some previously uncompleted portion, etc. Or (as with Maine and Kentucky), they tell us how many people registered for the exam, but not how many actually took it.  But in general these numbers are pretty reliable. Even when the rates do change, they normally change by less than 2-3%.  This year, the only one I’m really unsure how much the change will be is Maine. It is changing over to the UBE in July, and it is possible a lot of registered applicants skipped the Feb. exam in favor of the UBE upcoming.  For the other states, I’m think they are pretty reliable. 

Unknown (No 2017 Stats Posted)
Down 1% – 10%
Down 10% or More
Up
Unchanged

  • Alabama (Down 6%)
    • 2013 ~ 47%
    • 2017 ~ 41.3%
    • Sitting at 41-42% for 3 years now.
  • Alaska (Down 1%)
    • 2013 ~ 65%
    • 2017 ~ 64% 
    • For 5 years now ~ even years it goes up, odd years down to 64-65%. VERY Unstable (64% – 77% – this is the lowest so far since 2013)
  • Arizona (Down 15%)
    • 2013 ~ 66%
    • 2017 ~ 41%
    • Going down every year by a large #.
  • Arkansas (Unknown)
    • 2013 ~ 61%
    • 2017 ~ Currently Unknown
    • Varies between 61-65%. Last year sharp drop to 51%
  • California (Down 7%)
    • 2013 ~ 41%
    • 2017 ~ 34.5%
    • Has been dropping steadily since 2014.
  • Colorado (Down 7%)
    • 2013 ~ 69%
    • 2017 ~ 62%
    • Fell to and has been holding steady at 61-62% since 2015.
  • Connecticut (Down 22%)
    • 2013 ~ 72%
    • 2017 ~ 50%
    • Falling steadily since 2014.
  • Delaware (No Exam in February)
  • DC (Down 1%)
    • 2013 ~ 47%
    • 2017 ~ 46%
    • Except for 2015, DC has held steady at 46-47%
  • Florida (Down 10%)
    • 2013 (67%)
    • 2017 (57%)
    • Very Unstable, ranging from 45% (2016) to 73% (2014) 
  • Georgia (Down 15%)
    • 2013 ~ 66%
    • 2017 ~ 51%
    • Falling steadily every year since 2013
  • Hawai’i (Unknown)
    • 2013 ~ 66%
    • 2017 ~ Unknown
    • Fell from 2013 to 2015, then jumped 10% in 2016 to 73% passing. Not sure if the upwards or downward trend will continue.   In 2016 it was 73%, but in 2015 it was 62%.
  • Idaho (Down 6%)
    • 2013 ~ 75%
    • 2017 ~ 69%
    • Falling steadily every year since 2013
  • Illinois (Unknown)
    • 2013 ~ 75%
    • 2017 ~ Unknown
    • Falling steadily since 2014 (and 2014 and 2013 were the same 75%, so basically it’s fallen since 2013).  In 2016, it was 63%
  • Indiana (Down 21%)
    • 2013 ~ 69%
    • 2017 ~ 48%
    • Up and Down from 2013 – 2015.  Falling sharply in 2016 (down 12%) and 2017 (down another 7%).
  • Iowa (Down 6%)
    • 2013 ~ 75%
    • 2017 ~ 69% 
    • Falling steadily since 2014.
  • Kansas (Down 24%)
    • 2013 ~ 90%
    • 2017 ~ 66%
    • Fell steadily from 2013 to 2015.  Then in 2016, fell sharply by 25% to an overall rate of 56%.  Then in 2017 went back up to 66% (still much lower than 2015).  
    • In summary, my guess is it’s still going down next year. 
  • Kentucky (Unknown*)
    • 2013 ~ 74%
    • 2017 ~ Unknown
    • **Looks bad this year. Comparing only applicants to passers (no idea how many simply didn’t take the test), passage rate of 49.5%. But I don’t expect the number to be too different, since it’s the same exam as normal for Kentucky.
    • In 2016, the rate was 78%. It’s been sitting at around 74% – 78% from 2013-2016, so I’d expect it to return to that range. This year was a bit of a surprise and concern. 
  • Louisiana (Up 19%)
    • 2013 ~ 41%
    • 2017 ~ 60% 
    • Steadily rising from 2013 to 2016.  But this year (2017) it fell 6% which raises concerns it will start the downward trend now.  Not sure what to expect.
  • Maine (Unknown)
    • 2013 ~ 68%
    • 2017 ~ Unknown
    • Unofficially (comparing only applicants to passers) the rate is 32.2%.  But Maine is changing to the UBE in July, so I’ve been told a lot of people who registered ended up not taking it.  Usually the rate has been between 59-60% and I’d expect it to go back around there. 
  • Maryland (Down 5%)
    • 2013 ~ 63%
    • 2017 ~ 58%
    • Bouncing up and down between 47% and 63%. Been in the 50%s for 3 of the last 5 years.
  • Massachusetts (Down 16%)
    • 2013 ~ 63%
    • 2017 ~ 47.8%
    • Falling steadily for 5 years.
  • Michigan (Unknown)
    • 2013 ~ 62%
    • 2017 ~ Unknown
    • Been bouncing between 58% and 65% falling mostly in the 62-65% range.  
    • In 2016 it was 65%
  • Minnesota (Down 19%)
    • 2013 ~ 71%
    • 2017 ~ 52%
    • Falling by about 10% every 2 years.  This was the steepest drop so far though. 
  • Mississippi (Down 30%)
    • 2013 ~ 66%
    • 2017 ~ 35.7%
    • Went up in 2014, then has been falling ever since.  This still was a REALLY sharp drop from 2016’s 65%.  So I’m expecting it to go back up to around 55%-60% next year.
  • Missouri (Down 17%)
    • 2013 ~ 82%
    • 2017 ~ 66%
    • The scores have been falling steadily every year. If it follows the previous patter of the last 5 years, it’ll be around 61% maybe for 2018? 
  • Montana (Down 30%)
    • 2013 ~ 81%
    • 2017 ~ 51%
    • It fell by 14% in 2014, then went up again about 7% in 2015. Since 2015, it’s fallen by quite a bit each year. 
  • Nebraska (Unknown)
    • 2013 ~ 62%
    • 2017 ~ Unknown
    • Sharp drop to 43% in 2014, but since then it’s held steady at 59%.  In 2016 it was 59%
  • Nevada (Down 6%)
    • 2013 ~ 54%
    • 2017 ~ 49%
    • Went up until 2015, then started to fall ever since.
  • New Hampshire (Unknown)
    • 2013 ~ 57%
    • 2017 ~ Unknown
    • Scores keep bouncing, very uncertain. Ranging from 56% to 75%. In 2016, it was 64%
  • New Jersey (Down 18%)
    • 2013 ~ 59%
    • 2014 ~ 41%
    • Falling steadily since 2014.
  • New Mexico (Down 18%)
    • 2013 ~ 85%
    • 2017 ~ 67%
    • Falling steadily every year since 2013
  • New York (Down 6%)
    • 2013 ~ 50%
    • 2017 ~ 44%
    • Falling every year until 2016 (40%).  Then rose this year back up to 44%)
  • North Carolina (Down 13%)
    • 2013 ~ 49%
    • 2017 ~ 36.7%
    • Falling steadily since 2014.
  • North Dakota (Down 24%)
    • 2013 ~ 63%
    • 2017 ~ 39%
    • Falling every year since 2013.
  • Ohio (Down 16%)
    • 2013 ~ 67%
    • 2017 ~ 51%
    • Falling since 2014.
  • Oklahoma (Up 4%)
    • 2013 ~ 77%
    • 2017 ~ 81%
    • This was unexpected. For the last three years, the passage rate has sat at 67-69%. Then suddenly in 2017 it jumped up to 81%. I actually expect it to fall back to 65-69% next year.
  • Oregon (Down 2%)
    • 2013 ~ 69%
    • 2017 ~ 67%
    • Falling steadily through 2016 (60%). Then jumped back up to 67%. Not sure, but I expect it to go down a little bit next year. 
  • Pennsylvania (Down 7%)
    • 2013 ~ 61%
    • 2017 ~ 54%
    • Bouncing a bit, but slowly falling overall.  Might go up a few % next year and then fall some more the year after.  Kind of uncertain.
  • Rhode Island (Down 10%)
    • 2013 ~ 55%
    • 2017 ~ 45%
    • Falling significantly since 2014.
  • South Carolina (Down 13%)
    • 2013 ~ 73%
    • 2017 ~ 60%
    • Going up and down, but downward overall. Since it went up in 2017, I’d expect it to fall in 2018.
  • South Dakota (Unknown)
    • 2013 ~ 76%
    • 2017 ~ Unknown
    • Going down a lot overall, ranging from 76% (2013) to 26% (2015).  In 2016 it was 43%.
  • Tennessee (Down 13%)
    • 2013 ~ 59%
    • 2017 ~ 46.8%
    • Falling steadily since 2014
  • Texas (Down 26%)
    • 2013 ~ 74%
    • 2017 ~ 48%
    • Falling steadily since 2013
  • Utah (Unknown)
    • 2013 ~ 77%
    • 2017 ~ Unknown
    • Rising generally, but fell in 2016 by 14%.  In 2016 it was 66%
  • Vermont (Down 31%)
    • 2013 ~ 83%
    • 2017  52%
    • Erratic. Fell to 47% between 2013 – 2015. When up in 2016 to 61%. Then back down in 2017 to 52%.
  • Virginia (Down 4%)
    • 2013 ~ 57%
    • 2017 ~ 53%
    • Pretty steady around 57-59%. Not sure why so low this year.
  • Washington (Steady)
    • 2013 ~ 58%
    • 2017 ~ 57.8%
    • Had a high in 2014 (70.9%) but has since been falling steadily to below 2013 levels. Expect it to keep falling in 2018
  • West Virginia (Down 10%)
    • 2013 ~ 62%
    • 2017 ~ 52%
    • Falling Steadily each year through 2016 (51%). Went up 1% this year to 52%, but expect it to probably stay around the same 50-53% next year or fall again.
  • Wisconsin (Unknown)
    • 2013 ~ 85%
    • 2017 ~ Unknown
    • Falling steadily since 2013. Was 56% in 2016.
  • Wyoming (Unknown)
    • 2013 ~ 82%
    • 2017 ~ Unknown
    • Erratically bouncing between low 80% and mid 60%.  Since it was 62% in 2016, I’m betting it was a little higher for 2017. Then will be lower in the 60%s again for 2018.  

Falling National #Average on the #BarExam

10 May

Here are the National average Bar Passage Rates from 2007 – Current day.

  • 2007 ~ 67%
    • February ~ 55%
    • July ~ 73%
  • 2008 ~ 71%
    • February ~ 58%
    • July ~ 76%
  • 2009 ~ 68%
    • February ~ 53%
    • July ~ 74%
  • 2010 ~ 68%
    • February ~ 56%
    • July ~ 73%
  • ​2011 ~ 69%
    • ​February ~ 60%
    • July ~ 73%
  • ​2012 ~ 67%
    • February ~ 55%
    • July ~ 71%
  • ​2013 ~ 68%
    • ​February ~ 58%
    • July ~ 72%
  • 2014 ~ 64%
    • ​February ~ 57%
    • July ~ 67%
  • ​​2015 ~ 59%
    • February ~ 52%
    • July ~ 63%
  • ​2016 ~ 58%
    • February ~ 49%
    • July ~ 62%

I cant be the only person who thinks it was strange that the national average sat on 67-68% for several years. Nor the only person who finds it questionable that in 3 years, it suddenly dropped 10%. Something is wrong, and it cannot just be the students level.

I cannot count a lot of the states (they don’t say how many students sat and passed), but for the 19 states I could count for February 2017 the average was 50.01%.

If you failed the bar. . .

7 Apr

For anyone interested, I thought I’d mention a couple things I’ve learned from experience.

1. Studying for the Bar
Granted, I studied for the bar a couple years ago. But still, I think the way I studied for it worked out pretty well, and might help some of you. First, I was working for a law firm at the time and packing up for my move to China, so I had WAY limited time to study. I started by watching all of the Barbri videos and making a detailed outline (like 56 pages for one class, no lie). Which got me a great outline, but I didn’t really learn anything. I’m actually part visual part kinesthetic learner, so just hearing someone talk about it does absolutely NOTHING for me. So I changed my approach about 6-7 weeks before the exam. I started with the legal SPARKCHARTS. They are awesome, amazing, and all things good. They contained all the basics of what I needed to know, a great foundation. So I spent about a week learning them by heart for all the subjects on the test – MBE or Essay (I think there were 2 that it didn’t include — UCC and Commercial Papers). Once I understood the basics, I followed up with Emanuel’s books. I started with the brief outline at the beginning, filling in the gaps in my foundation. Again I spent about 3 weeks making sure those were well memorized. I just went over them, and over them. For the next 2 weeks, I studied the more in-depth reviews. Adding the odd exceptions in here and there where I needed them. If I were you, I’d probably try to spend more than 4 weeks on exceptions if that’s where you get stuck a lot. I just didn’t have time. I spent about 2 days reviewing the Barbri outlines. By this point, I actually knew most of the stuff in those outlines, but there were a few things Emanuel and Sparcharts hadn’t covered, so I’m glad I did the review. Finally, the last few days before the exam, I just did questions. Questions from Emanuel, Questions from the Barbri books. I did questions over and over and over. When I took the exam, my essays were my lower score (UCC and Commercial Papers showed up, so that sucked). But I still passed!

2. I didn’t do any practice essays. Once I figured out the MPT it was a piece of cake. That was actually really easy for me. I didn’t have to know about the law – I just had to write a good essay. For that, I would read the question – write down all the laws. Then I would re-read the question and add all the facts under each law. Then I spent a little time (10 min. or so) writing an Introduction and Conclusion. Last I spent a little time making sure my law and facts actually formed complete sentences in a logical pattern. This gave me the intro, each law was a paragraph, and a conclusion. For the other essays, I figured I knew how to do a good essay. I always get top scores on essay writing in general, and as long as I knew the law I knew I could do the essay. This turned out to be true for me. I know a lot of people who aren’t as good at writing or who go blank on essays who need to write the essays. I’d say that’s up to your study style.

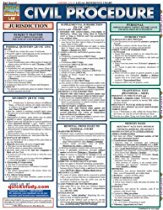
3. For Civil Procedure, I found that making an outline wasn’t helpful since I’m so visual / kinesthetic. So I took out giant poster-boards and used colored markers to make charts. I showed with different colors all the “If yes x” and “If no y” and made a map. It really helped me to see how things were connected and the flow of thought.

4. I’ve since become a law professor and found some other ways that helped me learn the law. The first is to make powerpoints for each subject. Pretend you are teaching students who cannot speak the language and have no background. Then create a powerpoint slide for each rule. It forces you to simply and make the connections more easily. Breaks everything down. Then allows you to re-organize the flow of the slides into something logical pattern that works for you. The second thing I find helpful is making up your own questions. Instead of just answering questions from other people, as you learn a rule and/or exception try creating your own multiple choice question on it with a fact pattern. You’ll find it’s more difficult, but it also gets you thinking how the Bar Testers think. I’ve found going back and reviewing the Barbri books and stuff that some of the questions I create for my students are basically the same as those they ask. But because I created it, I remember it better.

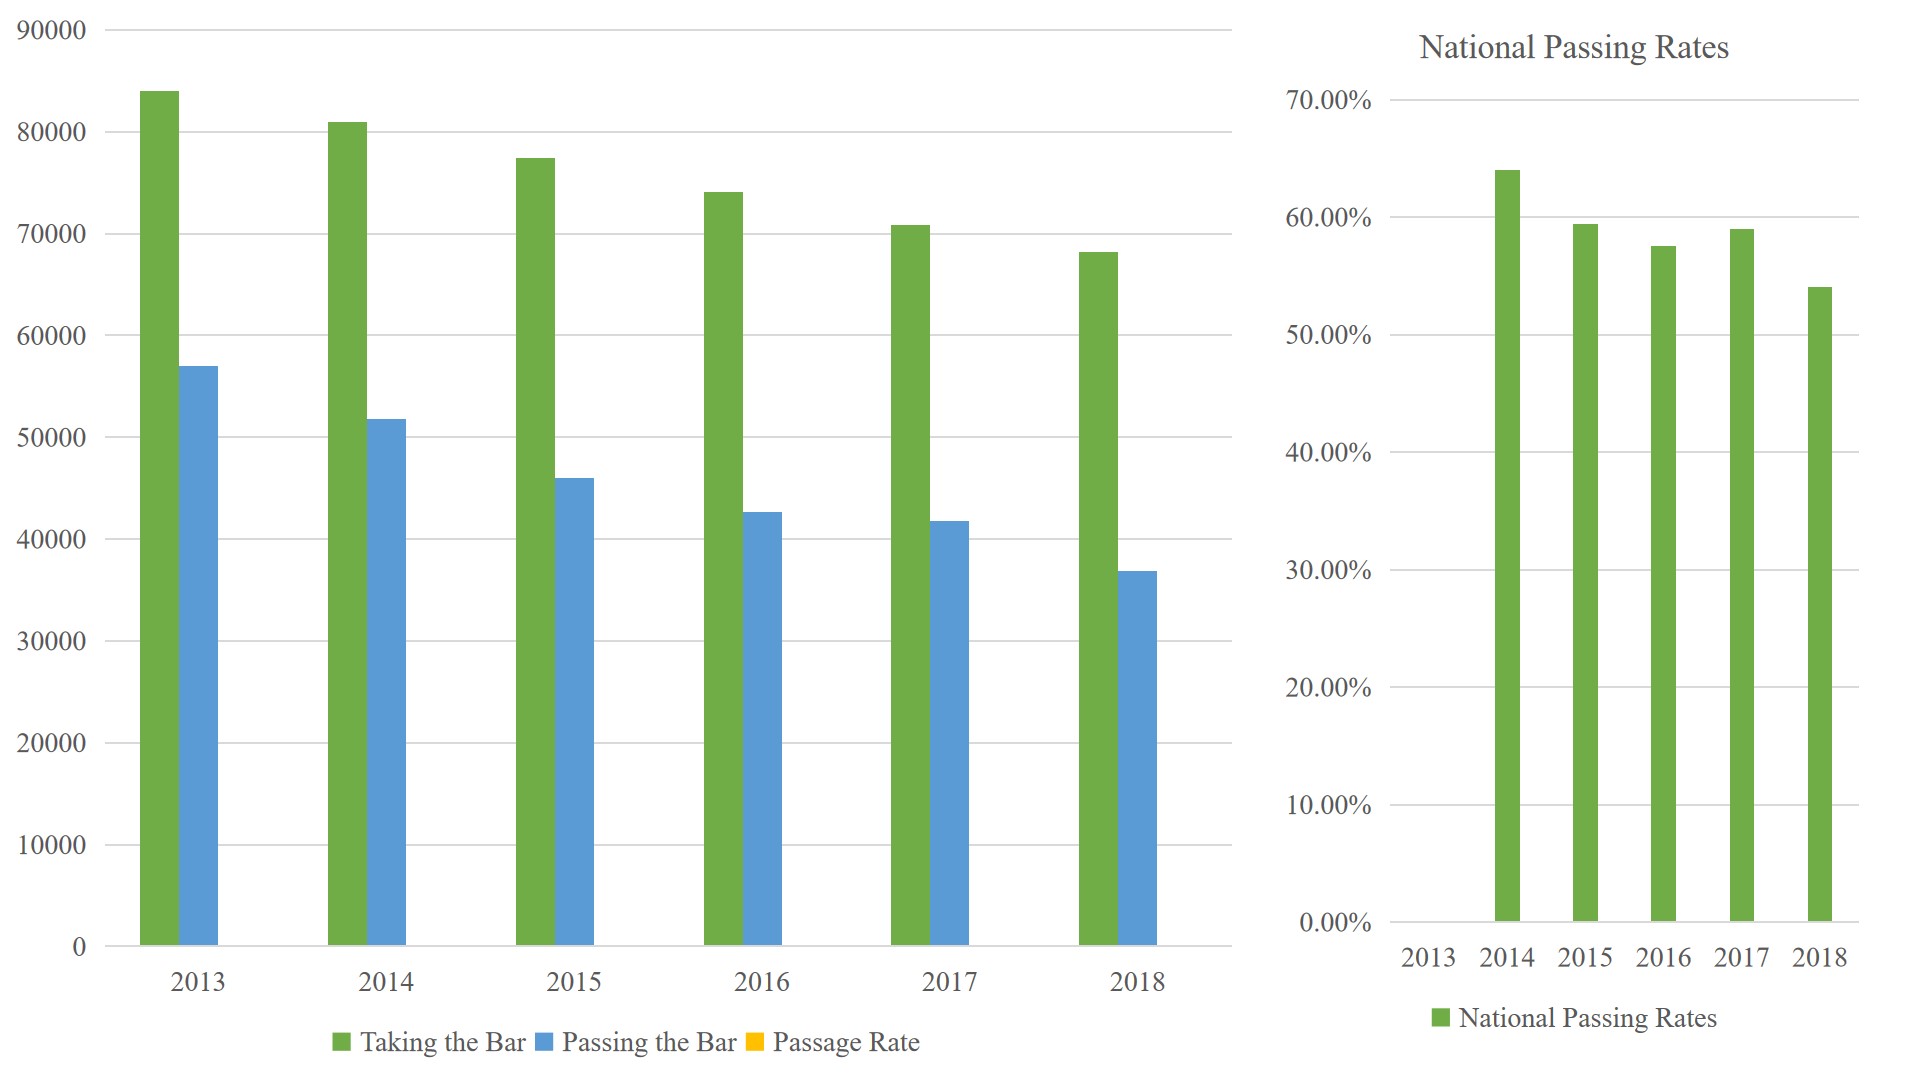
5. Don’t forget there are plenty of jobs you can do even without the bar exam. I know some people who fail it once, are quick to pass it the second time. But a lot of people struggle with test anxiety or other problems that keep them from getting over that hump. A lot of us simply cannot afford to keep taking it. Or maybe you figure out that anything this difficult or boring (after studying it forever, it gets boring) isn’t something you really want to do. There are lots of other options available. Some of my friends have gone on to become Court Clerks, Paralegals, School Librarians, University Department Heads, Government Teachers, Social Sciences Teacher, Legal English Teachers, and more. You can teach legal studies to undergraduates and the like. Others went back to school, got an alternative masters, and did something else. Or they became CPAs or Auditors or Business professionals. You can become a writer – did you know many of the crime shows are written by ex-criminal law lawyers? It’s because they can see the story and how it developed. I passed the bar exam, but knew really quickly that it wasn’t where I wanted my life to go. I went to law school to study Cultural Heritage Law. I had NO interest in being a family lawyer (tried that, got a corrupt / chauvinistic judge), criminal lawyer (tried that, got abused, called all hours of the night, and was never paid by the clients), guardian ad litem (tried that, saw more corrupt cops and judges and got depressed being around all the abusive families). You see a pattern? Let’s just say it wasn’t my cup of tea. That’s why I’m now a law and business professor in Asia. I teach international students and I love it! I use what I learned in school and work hard, but I get good pay and fine vacations. The students are a lot more fun to work with, and I get to travel around. I’m not telling you not to try to take the bar again, just know that you have options if you decide it isn’t what you want to do. Even if you passed, but aren’t looking forward to the normal line of work.

As my students say, “Fighting!”

#IL, #ND, #WV, and #IA Bar Results are Out!

31 Mar

Congratulations to everyone who passed!  Illinois, North Dakota, West Virginia, Kansas, and Iowa have released the Bar Exam Results from the February Exam – beat out North Carolina this year. 🙂

Passing Rates:

Kansas ~ 66%
Iowa ~ 69%

North Dakota ~ 39%
West Virginia ~ 52.4%


#LawSchool and #BarExam Study Aids!

17 Feb

LAW SCHOOL & BAR EXAM STUDY RESOURCES

A few people have asked me for a list of resources for studying. For those of you still in Law school, still studying for the bar, or who need to try again, I tried putting together a comprehensive list (sorted Alphabetically and by Series) of the best Study Guides for the bar based on what I used, what my friends recommended, and what other lawyers I’ve spoken with advised. I’ve used all of these, and I think they really helped me with both Law School itself and the bar exam.  In fact, If I were taking the exam in again (eg in different state), I’d probably use Sparkcharts and Emanuel all by themselves.  You can find the list HERE (or click on one of the images below).

law-2law-3law-4law-1

law-5law-6law-8law-7

%d bloggers like this: