Archive | Business & Economics RSS feed for this section

Is Apple Losing Favor?

26 Sep
See the source image

Apple has a problem. . .

Six years ago when I first came to China, Steve Jobs was their hero much like Jack Ma. He came from a nondescript background and built a billion-dollar company.

They loved anything and everything Apple — walking in with the newest iPhone was a necessity for flaunting economic status much as wearing Louis Vuitton or Coco Chanel.

This week I polled my students about their impressions of the new iPhone.

See the source image

Approximately 200 students spread across five classes participated as I asked them

  • 1) Who (if you had the money) would purchase the new iPhone? and
  • 2) Who (even if you had the money) would not?

Amongst all the students (and with a good 80-85% participation rate), fewer than 15 raised their hands that they would buy. The vast majority actively stated they had no interest in the new phone.

Many cited appearance, but others pointed to

  1. Customer service,
  2. Unreasonable pricing for the value,
  3. Expensive and incompatible accessories,
  4. Non-integration with educational and professional needs (.pages doesn’t open on many computers), 
  5. Preference for domestic brands 
  6. Other

These students are in one of the most expensive programs in China. They ARE the ones who have the money . . . if they aren’t buying, it’s not looking good. 

Anyone else get similar impressions?

Queen of Problem Solving!

14 Sep

You know that Job interview question “What is one time you faced a difficult situation and how did you resolve or handle the situation?” I like that question, because let me count the ways!

Just spent a week working with a US partner, the US partner’s supplier, the supplier’s International division, the US supplier again, their superior, and their superior’s superior — they concluded we couldn’t do what needed to be done.

After reviewing the online system capabilities, I found a way and instead we have successfully set up a program to run the system out of both US and China. It just took 10 minutes to adapt, and voila! We are up and running!

If nothing else, working internationally gives you a lot of experience in handling difficult situations and in finding innovative solutions. Sometimes you have to patchwork things together with duct tape and glue to get it operating, but success is always possible — somehow, somewhere. You just have to be open-minded enough to try many solutions until you find the right one.

PEST(EL) ~ A Macroeconomic Analysis

21 Aug
PESTEL

One of the more useful business models popular today remains the PEST(EL) model. PEST(EL) is a macroeconomic analysis model often used by businesses to assess the general market conditions of a new or changing environment. The model lays out a set of normally 4-6 market factors relevant to the business and assesses strengths, weaknesses, and changes therein.

First introduced by Francis Aguilar in 1967, the model has undergone several transformations through the years. Therein lies one its greatest strengths – the model is flexible and is easily adapted or modified to suit the particular market needs or situation.

The most basic and standard format is known as PEST representing political, economic, social, and technological factors.

The model lays out an assessment of key issues or opportunities offered by the national economy and industry. Management can review the factors and quickly assess general potential within the industry or quickly discard economies that are not feasible.

The model itself is not in-depth and must be combined with other models (e.g. SWOT, Ansoff, or Five Forces) should the company wish to continue its analysis. It can also be combined with other macroeconomic models for a more reliable assessment. Detailed information regarding market competition, competitive advantages, supply chain improvement potential, etc. is not covered within this model.

Still, it does provide management with a relatively quick overview of the market itself. Markets not even relatively viable are quickly identifiable, saving management both time and money within the research and strategy stages. At the end of the PEST analysis, the management and decision makers should also have a general understanding of the economy and industry — trends, emerging patterns, major issues, potential opportunities. Management can then more easily identify where to focus its attention and research going forward.

As mentioned above, the model can also be adapted to include factors other than the traditional four. Some variations include:

  • PEST(EL) → Political, Economic, Social, Technological, Environmental, Legal
  • PESTLED → Political, Economic, Social, Technological, Ethics, Demographics

Generally the factors are up to you. Carefully assess your company and focus on the key macro factors specifically affecting you and your planned strategy.

Below is a modified PEST analysis based on the Chinese company Misway and their translator SMARK.

Corporate Balance Sheet & Income Statement (Automatically Formulated Worksheet with Metrics)

28 Feb

Hey guys!

A while back I posted a sample of a corporate balance sheet to use for informal work (e.g. in a classroom).  Unfortunately, that version was in Document form, rather than in Excel, so you had to do all the calculations yourself. 

This semester, I taught Introduction to Business, wherein students had to complete sample Balance Sheets and Income Statements as part of the ‘intro to accounting’ and ‘finance’ sections in the course. To help with their projects and give them a leg up in the future, I gave them an Excel version of a balance sheet.  

Balance.pngI’ve now expanded this file to include:

  • Balance Sheet
  • Income Statement
  • Some General Metrics (e.g. Working Capital, Gross Profit Margin, Inventory Turnover).

Links:

Features of the file include:

Continue reading

This Makes My Brain Tired 0_0

21 Nov

Studying Business Operations is a bit like those old logic puzzles: If Sarah and Jim are working on Project A and Tom and Valerie are doing Project B, when can Sarah and Rob start on Project C sitting together next to the bride and groom, but not next to Maggie who is not married to Sam?

#Economics 101 ~ Absolute Advantage, Comparative Advantage, and the PPF

1 Oct

*As always, this is not intended to be professional advice. This was written with ESL students in mind, designed for a basic #Economics class. We simply hope that it may be helpful to other students trying to understand the concept.

UNDERSTANDING THE PPF

PPF.jpg

The two lines you see up above are called Product Possibility Frontiers or the PPF.

Situation: Vietnam (越南) and Thailand (泰国) both are given $500 to make Swords (剑) or Bows & Arrows (弓箭). Because their money is limited (有限) (there is an end to the money), both countries need to decide how many they should make. Problem: if they spend money on swords, that means less money for bows and arrows. And if they spend money on bows and arrows, that means less money available for swords. It’s a CHOICE (or in economics — a TRADE-OFF).

They have three choices: 1) Make only Swords. 2) Make only Bows and Arrows. 3) Make some of both.

The green line (Vietnam) shows all the possible combinations (组合) that Vietnam can make if it uses ALL the money ($500). Continue reading

What is the #Supply (供给) Curve?

8 Jun

What is the #Supply Curve in #Economics?
Supply is the number of products currently available for sale.

In #Microeconomics, we often look at the supply of one company (how many that company has ready for trade).

In #Macroeconomics, we sometimes talk about Aggregate Supply (how many are up for sale in the entire market).

Below is a simple explanation of the Supply Graph and what you need to know!

Let’s say that Mike is buying pencils from Metro (Màidélóng)

We want to know what price should Mike offer?

Suipply Curve.jpg

This picture is very helpful! The light Green Line (supply ) tells us how many pencils Metro will have available for sale at each price.

Situation #1: The price is $3.00, Metro will have 30 pencils available for sale.

Situation #2: The price is $1.00, Metro will have 10 pencils available for sale.

Situation #3: The price is $4.00 and Mike wants 25 pencils. Can Mike buy those 25 from Metro?

Answer: Yes! Mike wants 25 pencils and Metro has 40 pencils. So Mike can buy 25 pencils at Metro for $4.

Situation #4: The price is $4.00 and Mike wants 50 pencils. Can Mike buy 50 pencils from Metro?

Answer: No! Mike wants 50 pencils, but Metro only has 40. So Mike can get 25 pencils or even 40 pencils. But he cannot buy 50 pencils for $4.00 because the store will not have enough.

So we could draw the picture like this:

Supply 2

So what is the Supply Curve?

  • It tells us the MAXIMUM (最大) number of products Metro will have available for sale at each price.
  • It tells us how many products Mike CANNOT buy.
  • It gives us an idea of what price we should choose. For example, if the price is $8.00, Mike can buy 80 pencils! But if the price is $1, he can only buy 5 pencils.

Law of Supply (供给法则) ~ When price increases (), more products will be available for sale.

Economy Outline for #Macroeconomics

21 May

economic-outline.jpg

This picture is designed for my Macroeconomics students (and any others who may find it useful). 

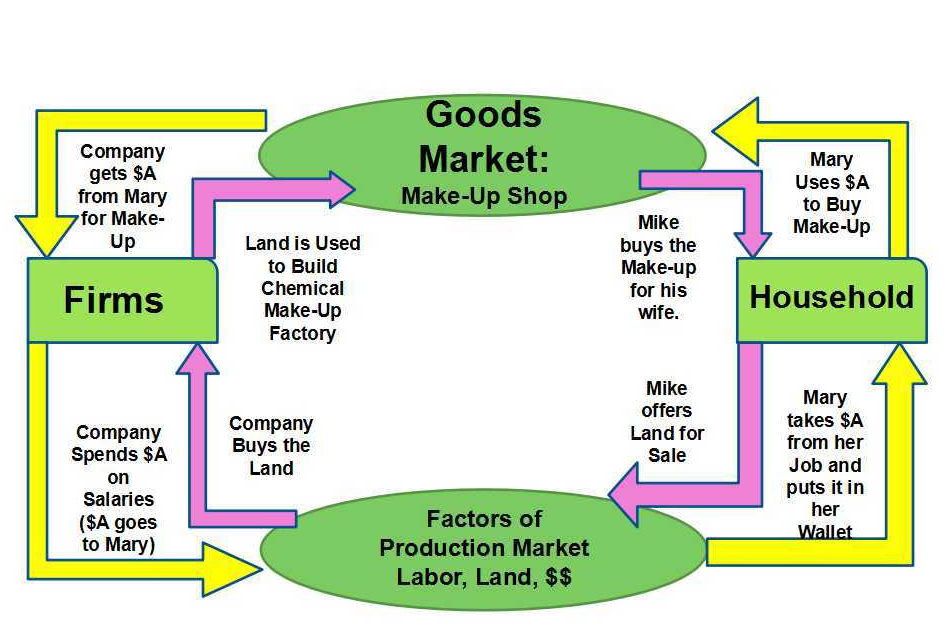
In Economics, we are given a very helpful “Photo” or picture of the economy called the Circular Flow Diagram. (remember, “circular flow” means ‘to go in a circle’). 

circular-flow-diagram.jpg

We know from this picture that every economy is made up of two kinds of stores — 1) those that sell products they have created to consumers (Product Market) and 2) those that sell the factors of production like land, labor, and capital (Factors of Production Market).

Economic Trade = Goods Market + Factors of Production Market

Each market is then made up of Supply and Demand.  Supply is how many products the store has available for sale. Demand is how many products the buyer will purchase if given the opportunity. 

Let’s say the Quantity Supplied is 20. . . . why 20? Why not 0? What can we do to make the store offer more? What can we do to have lower supply?

Supply is made up of six main factors:

  • Price of the product
  • Price of Inputs (cost of making the product)
  • Price of Related Goods in Supply (for example, the price / revenue of an alternative product)
  • Level of Technology
  • Expected Future Price
  • Number of Companies in the market.

Demand is also made up of six main factors:

  • Price of the product
  • Income of the buyers
  • Price of Related Goods in Demand (for example, the price/cost of buying an alternative product)
  • Level of Taste (do you like it)
  • Expected Future Price
  • Number of Buyers in the market.


Everything we study in Microeconomics and Macroeconomics fits into this picture of the economy.   All of our resources go into one of the two markets. All of our topics fit into Supply and/or Demand.  All issues are somewhere in the factors of supply or demand.

Unemployment for example is often a problem in demand (no companies want to hire).  Where in demand? — Maybe Taste (they don’t like the new graduates, think they are lazy) or Price (the workers are demanding higher salaries). 

GDP is an issue involving lots of factors — Number of Buyers (population), Income, Prices, etc.

Price Controls & Equilibrium – Prices, Price of Inputs, Price of Related Goods, Future Prices

Interest Rates – Prices and Income

Inflation – Prices and Income

As long as you understand the factors of the economy, you should start to see why we look at the things we do for economics classes!


What is the #DemandCurve in #Economics?

18 May

What is the #Demand Curve in #Economics?
Demand is the number of products the buyers are willing to purchase.

In #Microeconomics, we often look at the demand of one company or buyer.

In #Macroeconomics, we sometimes talk about Aggregate Demand (how many are will all buyers in the market purchase at each price). 

Below is a simple explanation of the Supply Graph and what you need to know!

Let’s say that Mike is buying pencils from Metro (Màidélóng)

We want to know what price should Metro charge?

Demand Curve.jpg

This picture is very helpful! The light Green Line  (Demand – 需求) tells us how many pencils Mike will buy at each price.

Situation #1: The price is $3.00, Mike is willing to buy 50 pencils.

Situation #2: The price is $1.00, Mike is willing to buy 70 pencils.

Situation #3: The price is $4.00 and Metro has 30 pencils. Will Mike buy them?

Answer: Yes! Mike wants 40 pencils, of course he would buy 30 if they are available.

Situation #4: The price is $4.00 and Metro has 50 pencils. Will Mike buy them?

Answer: No! Mike only wants 40 pencils, so he is never going to buy 50.

So we could draw the picture like this:

Demand Possibility.jpg

So what is the Demand (需求) Curve?

  • It tells us the MAXIMUM (最大) number of products Mike will buy at each price.
  • It tells us how many products Mike will NOT buy.
  • It gives us an idea of what price we should choose. For example, if the price is $8.00, Mike won’t buy any pencils!

Law of Demand (需求法则) ~ When price increases (), buyers will be willing to buyer less products than before (when price goes up, we buy less).

Price of Related Goods (PR) in #Economics

3 May

An #Infograph for my Chinese students in #microeconomics and #macroeconomics 

When we study Supply and Demand in #economics, we learned that one of the factors that changes them both is Price of Related Goods.  

  • Supply — The number of products the company has available to sell at all prices
  • Demand — The number of products the buyers will purchase at all prices
  • Quantity Supplied — The number of products supplied at a specific price
  • Quantity Demanded — The number of products demanded at a specific price
  • Inverse Relationship — When Y ↑   then X ↓ — Line goes down
  • Direct Relationship — When Y ↑  then X   ↑ — Line goes up

#business #studyguide #econ 

new-piktochart_30078936