Tag Archives: Demand

Economy Outline for #Macroeconomics

21 May

economic-outline.jpg

This picture is designed for my Macroeconomics students (and any others who may find it useful). 

In Economics, we are given a very helpful “Photo” or picture of the economy called the Circular Flow Diagram. (remember, “circular flow” means ‘to go in a circle’). 

circular-flow-diagram.jpg

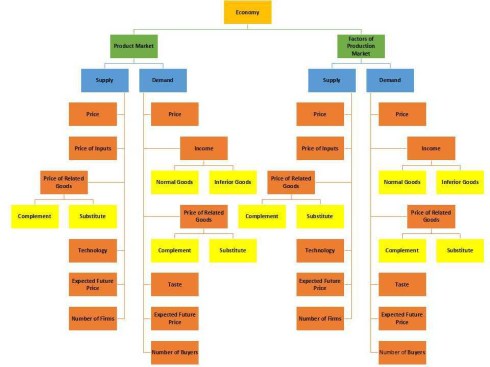
We know from this picture that every economy is made up of two kinds of stores — 1) those that sell products they have created to consumers (Product Market) and 2) those that sell the factors of production like land, labor, and capital (Factors of Production Market).

Economic Trade = Goods Market + Factors of Production Market

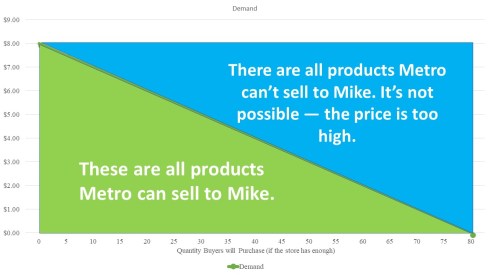
Each market is then made up of Supply and Demand.  Supply is how many products the store has available for sale. Demand is how many products the buyer will purchase if given the opportunity. 

Let’s say the Quantity Supplied is 20. . . . why 20? Why not 0? What can we do to make the store offer more? What can we do to have lower supply?

Supply is made up of six main factors:

  • Price of the product
  • Price of Inputs (cost of making the product)
  • Price of Related Goods in Supply (for example, the price / revenue of an alternative product)
  • Level of Technology
  • Expected Future Price
  • Number of Companies in the market.

Demand is also made up of six main factors:

  • Price of the product
  • Income of the buyers
  • Price of Related Goods in Demand (for example, the price/cost of buying an alternative product)
  • Level of Taste (do you like it)
  • Expected Future Price
  • Number of Buyers in the market.


Everything we study in Microeconomics and Macroeconomics fits into this picture of the economy.   All of our resources go into one of the two markets. All of our topics fit into Supply and/or Demand.  All issues are somewhere in the factors of supply or demand.

Unemployment for example is often a problem in demand (no companies want to hire).  Where in demand? — Maybe Taste (they don’t like the new graduates, think they are lazy) or Price (the workers are demanding higher salaries). 

GDP is an issue involving lots of factors — Number of Buyers (population), Income, Prices, etc.

Price Controls & Equilibrium – Prices, Price of Inputs, Price of Related Goods, Future Prices

Interest Rates – Prices and Income

Inflation – Prices and Income

As long as you understand the factors of the economy, you should start to see why we look at the things we do for economics classes!


What is the #DemandCurve in #Economics?

18 May

What is the #Demand Curve in #Economics?
Demand is the number of products the buyers are willing to purchase.

In #Microeconomics, we often look at the demand of one company or buyer.

In #Macroeconomics, we sometimes talk about Aggregate Demand (how many are will all buyers in the market purchase at each price). 

Below is a simple explanation of the Supply Graph and what you need to know!

Let’s say that Mike is buying pencils from Metro (Màidélóng)

We want to know what price should Metro charge?

Demand Curve.jpg

This picture is very helpful! The light Green Line  (Demand – 需求) tells us how many pencils Mike will buy at each price.

Situation #1: The price is $3.00, Mike is willing to buy 50 pencils.

Situation #2: The price is $1.00, Mike is willing to buy 70 pencils.

Situation #3: The price is $4.00 and Metro has 30 pencils. Will Mike buy them?

Answer: Yes! Mike wants 40 pencils, of course he would buy 30 if they are available.

Situation #4: The price is $4.00 and Metro has 50 pencils. Will Mike buy them?

Answer: No! Mike only wants 40 pencils, so he is never going to buy 50.

So we could draw the picture like this:

Demand Possibility.jpg

So what is the Demand (需求) Curve?

  • It tells us the MAXIMUM (最大) number of products Mike will buy at each price.
  • It tells us how many products Mike will NOT buy.
  • It gives us an idea of what price we should choose. For example, if the price is $8.00, Mike won’t buy any pencils!

Law of Demand (需求法则) ~ When price increases (), buyers will be willing to buyer less products than before (when price goes up, we buy less).

Price of Related Goods (PR) in #Economics

3 May

An #Infograph for my Chinese students in #microeconomics and #macroeconomics 

When we study Supply and Demand in #economics, we learned that one of the factors that changes them both is Price of Related Goods.  

  • Supply — The number of products the company has available to sell at all prices
  • Demand — The number of products the buyers will purchase at all prices
  • Quantity Supplied — The number of products supplied at a specific price
  • Quantity Demanded — The number of products demanded at a specific price
  • Inverse Relationship — When Y ↑   then X ↓ — Line goes down
  • Direct Relationship — When Y ↑  then X   ↑ — Line goes up

#business #studyguide #econ 

new-piktochart_30078936

%d bloggers like this: