Tag Archives: Economics

Is Apple Losing Favor?

26 Sep
See the source image

Apple has a problem. . .

Six years ago when I first came to China, Steve Jobs was their hero much like Jack Ma. He came from a nondescript background and built a billion-dollar company.

They loved anything and everything Apple — walking in with the newest iPhone was a necessity for flaunting economic status much as wearing Louis Vuitton or Coco Chanel.

This week I polled my students about their impressions of the new iPhone.

See the source image

Approximately 200 students spread across five classes participated as I asked them

  • 1) Who (if you had the money) would purchase the new iPhone? and
  • 2) Who (even if you had the money) would not?

Amongst all the students (and with a good 80-85% participation rate), fewer than 15 raised their hands that they would buy. The vast majority actively stated they had no interest in the new phone.

Many cited appearance, but others pointed to

  1. Customer service,
  2. Unreasonable pricing for the value,
  3. Expensive and incompatible accessories,
  4. Non-integration with educational and professional needs (.pages doesn’t open on many computers), 
  5. Preference for domestic brands 
  6. Other

These students are in one of the most expensive programs in China. They ARE the ones who have the money . . . if they aren’t buying, it’s not looking good. 

Anyone else get similar impressions?

Queen of Problem Solving!

14 Sep

You know that Job interview question “What is one time you faced a difficult situation and how did you resolve or handle the situation?” I like that question, because let me count the ways!

Just spent a week working with a US partner, the US partner’s supplier, the supplier’s International division, the US supplier again, their superior, and their superior’s superior — they concluded we couldn’t do what needed to be done.

After reviewing the online system capabilities, I found a way and instead we have successfully set up a program to run the system out of both US and China. It just took 10 minutes to adapt, and voila! We are up and running!

If nothing else, working internationally gives you a lot of experience in handling difficult situations and in finding innovative solutions. Sometimes you have to patchwork things together with duct tape and glue to get it operating, but success is always possible — somehow, somewhere. You just have to be open-minded enough to try many solutions until you find the right one.

Economy Outline for #Macroeconomics

21 May

economic-outline.jpg

This picture is designed for my Macroeconomics students (and any others who may find it useful). 

In Economics, we are given a very helpful “Photo” or picture of the economy called the Circular Flow Diagram. (remember, “circular flow” means ‘to go in a circle’). 

circular-flow-diagram.jpg

We know from this picture that every economy is made up of two kinds of stores — 1) those that sell products they have created to consumers (Product Market) and 2) those that sell the factors of production like land, labor, and capital (Factors of Production Market).

Economic Trade = Goods Market + Factors of Production Market

Each market is then made up of Supply and Demand.  Supply is how many products the store has available for sale. Demand is how many products the buyer will purchase if given the opportunity. 

Let’s say the Quantity Supplied is 20. . . . why 20? Why not 0? What can we do to make the store offer more? What can we do to have lower supply?

Supply is made up of six main factors:

  • Price of the product
  • Price of Inputs (cost of making the product)
  • Price of Related Goods in Supply (for example, the price / revenue of an alternative product)
  • Level of Technology
  • Expected Future Price
  • Number of Companies in the market.

Demand is also made up of six main factors:

  • Price of the product
  • Income of the buyers
  • Price of Related Goods in Demand (for example, the price/cost of buying an alternative product)
  • Level of Taste (do you like it)
  • Expected Future Price
  • Number of Buyers in the market.


Everything we study in Microeconomics and Macroeconomics fits into this picture of the economy.   All of our resources go into one of the two markets. All of our topics fit into Supply and/or Demand.  All issues are somewhere in the factors of supply or demand.

Unemployment for example is often a problem in demand (no companies want to hire).  Where in demand? — Maybe Taste (they don’t like the new graduates, think they are lazy) or Price (the workers are demanding higher salaries). 

GDP is an issue involving lots of factors — Number of Buyers (population), Income, Prices, etc.

Price Controls & Equilibrium – Prices, Price of Inputs, Price of Related Goods, Future Prices

Interest Rates – Prices and Income

Inflation – Prices and Income

As long as you understand the factors of the economy, you should start to see why we look at the things we do for economics classes!


What is the #DemandCurve in #Economics?

18 May

What is the #Demand Curve in #Economics?
Demand is the number of products the buyers are willing to purchase.

In #Microeconomics, we often look at the demand of one company or buyer.

In #Macroeconomics, we sometimes talk about Aggregate Demand (how many are will all buyers in the market purchase at each price). 

Below is a simple explanation of the Supply Graph and what you need to know!

Let’s say that Mike is buying pencils from Metro (Màidélóng)

We want to know what price should Metro charge?

Demand Curve.jpg

This picture is very helpful! The light Green Line  (Demand – 需求) tells us how many pencils Mike will buy at each price.

Situation #1: The price is $3.00, Mike is willing to buy 50 pencils.

Situation #2: The price is $1.00, Mike is willing to buy 70 pencils.

Situation #3: The price is $4.00 and Metro has 30 pencils. Will Mike buy them?

Answer: Yes! Mike wants 40 pencils, of course he would buy 30 if they are available.

Situation #4: The price is $4.00 and Metro has 50 pencils. Will Mike buy them?

Answer: No! Mike only wants 40 pencils, so he is never going to buy 50.

So we could draw the picture like this:

Demand Possibility.jpg

So what is the Demand (需求) Curve?

  • It tells us the MAXIMUM (最大) number of products Mike will buy at each price.
  • It tells us how many products Mike will NOT buy.
  • It gives us an idea of what price we should choose. For example, if the price is $8.00, Mike won’t buy any pencils!

Law of Demand (需求法则) ~ When price increases (), buyers will be willing to buyer less products than before (when price goes up, we buy less).

Price of Related Goods (PR) in #Economics

3 May

An #Infograph for my Chinese students in #microeconomics and #macroeconomics 

When we study Supply and Demand in #economics, we learned that one of the factors that changes them both is Price of Related Goods.  

  • Supply — The number of products the company has available to sell at all prices
  • Demand — The number of products the buyers will purchase at all prices
  • Quantity Supplied — The number of products supplied at a specific price
  • Quantity Demanded — The number of products demanded at a specific price
  • Inverse Relationship — When Y ↑   then X ↓ — Line goes down
  • Direct Relationship — When Y ↑  then X   ↑ — Line goes up

#business #studyguide #econ 

new-piktochart_30078936

The #Royalty is here! Now go away. . . . (#Teaching humor)

15 Apr

My class roster: Duke, King, Noble, Catherine, Peter, Ivan, Henry, Harry, Elizabeth, Helen, Kate, William, John, Robert, James, Solomon, David

Me : Now that the royalty has all arrived. . . Let’s talk about why Feudalism is a terrible system. 

safe_image

OFO Bike Sharing Market Research

3 Dec

Image result for OFO

My students in microeconomics were recently studying quantity demand and ways to improve profits. Before we moved onto changing prices, we spent some time discussing ways they can change or alter the other 5 factors of demand (Income, Price of Related Goods, Taste, Future Price, and Number of Buyers in the Market).

This brought us to Consumer Research and how companies gather information about their buyers, products, and demand markets.

I recently noticed that the OFO bicycle system has just started operating on the Northeast Normal University campus this semester. For those of you unfamiliar with the system, OFO is an app that allows users to rent bicycles and drive them around town with no designated pick-up or drop-off site.

It was originally founded in Beijing in 2014, but has since spread to cities around China and more countries besides.

The theory of the system is rather simple.

Users download the application on their cell phones and set up an account. The start-up deposit fee has traditionally been 199RMB in China (about $30) which then goes to your account. Then it costs a small amount (1-2RMB) per hour (about $0.16) that you ride. To get a bicycle you locate the familiar yellow bike and use the Code Scanner on your phone to read the bicycle’s bar code. That registers the bicycle to you, and you then ride around wherever you want to go. When you are finished, you cancel the agreement and leave the bicycle wherever you stopped.

There are many conveniences to the program (handy for local transportation, students enjoy the system). But there are some inconveniences as well (too many bicycles left lying in the way of sidewalks and doors, bicycles can be difficult to find, etc).

So I arranged a small market survey and sent it out to my students. They shared it with the freshman (and a few with their parents / siblings) and we used KwikSurveys.com to analyze our results.

Although it is not official, it was a lot of fun and we did learn some interesting results that I thought I would share.

Income

We started by testing the income level of our respondents. We agreed that 199RMB was a lot for students with less than 1000RMB per month. There were a few students who thought it was too expensive as a start-up deposit. Especially since most of them felt they may not ever use that much money in the long run. Some of the students complained that since Changchun is in the north (with very cold weather very early in the fall and late in the sprint), their time to use it was limited. This much money for something they would only use a few months was a stretch.

Demographics

To get a feel for our response bias and the real category of people we reached, we also established some demographics.  

Most of the boys agreed they had tried it, but we had a difficult time getting them to take the survey. 🙂

The students also agreed that, although our survey never reached them, their parents and grandparents were a possible market for OFO. Several students said their parents had already tried it as well. The 21 – 25 year olds were mostly our Junior students. The 15-18 year olds were Freshmen.

Reputation of OFO

At this point, most of the students were familiar with the system. Those who did not recognize the same were aware of the “Yellow Bicycle”

PAST PERFORMANCE

The students also agreed that 24% was a high number for a company like OFO. Although it has only been in Changchun this year, it has been operating in China for a while. They recommended that OFO help teach people how to ride bicycles or show people how to set up the account. They felt like there was not enough information about OFO or people introducing them to OFO.

Some students (and me) had trouble setting up the OFO account. Most of the unhappy users felt like the system was clear, but it often didn’t work or was broken. They complained that they would try to put in all the information and then would get an error code. But quite a few thought it went pretty smoothly.

The Bicycle “easy to reserve” part was must less satisfying amongst the students. The majority complained that there weren’t enough bicycles. They paid a high start-up deposit fee, but then could not ever find bicycles in their area. The bicycles were far away or were already being used. They wanted OFO to provide more bicycles in the area. At the same time, we discussed Beijing and Shanghai’s problems where there are TOO many bicycles available. The bicycles are parked on the sidewalks, and with so many taking up the space, people are forced to walk in the busy streets.

Most agreed that they enjoyed the experience overall. Some felt that it was too cold when they tried it (October — people in the far north are already bundling up for winter and heaters are turning on). Perhaps after summer they will have a different impression. Others felt like it was a lot of money and aggravation to get it all going. Many felt like it was a lot of fun for entertainment, but would not replace taxi or DiDi services.

FUTURE INTEREST

Overall, students seemed to feel that the program had a lot of potential and possibility. They did however think there were areas where it could be improved. It was a fascinating discussion, and the students responded very well!

Abbreviations are CRAZY

28 Nov
Me: “If I give you Q, TVC, and TFC you can find TC, AVC, AFC, SMC, ATC, etc.”
 
Students: 😓😵
 
Me: 🤣 Let’s try it step by step. . .

Snickerdoodle #Treats!

31 Oct

Making yummy #Snickerdoodles for the 8 #proctors of my #exam today 😊  320 students, 4 classrooms, one exam.  Go #microeconomics students!!!  Fighting!!  Jiayou!

#Business and #Economics ~ Consumer Surplus Explained

30 Oct

As always, this lesson is not intended to be professional advice. This is simply lesson material for ESL students in an introductory Economics and Finance class. Posted here for their use or for helping other students. 

This is not intended to be an advanced, in-depth economic analysis of consumer surplus. However, in teaching the concept to my students, I discovered that most websites and teaching materials did not explain the material very well.  They all wanted to start with Consumer Surplus is X – Y .  . . and oh, by the way, it’s also the area of a triangle! 😀 

Which sucks, because it does not explain why it is the area of the triangle.  

So for all the beginning 101 ESL students, I hope this helps explain it!

Part #1 ~ Vocabulary

  • Buyer (n.) ~ A person who exchanges their money in return for a product. Someone who purchases the product. 买方 – Mǎifāng
  • Competition (n.) ~ A situation where two or more people are struggling to claim the same resource.  In economics and business, sellers of substitutes are competing for the same buyers. 竞争 – Jìngzhēng
  • Consumer Surplus (n.) ~ The difference between the price the buyer would have paid for a product and the price the buyer did pay for the product.   消费者过剩 – Xiāofèi zhě guòshèng
  • Demand Curve (n.) ~ A line showing the relationship between the number of products people want to buy and the price. The demand curve shows how many products are demanded at each price. 需求曲线 – Xūqiú qūxiàn
  • Discount (n.) ~ How much the seller has decreased the price from its original amount. Tommy changed the price of his bicycles from $400 to $300. This is a 25% discount. 折扣 – Zhékòu
  • Discount (v.) ~ To lower the price. When the seller lowers the price of a product in order to increase demand, they discount the price. 贱卖 – jiàn mài
  • Economic Value (n.) ~ The maximum price that a buyer would have paid for a product. The demand curve shows the economic value for each quantity. 经济价值 – Jīngjì jiàzhí
  • Law of Demand (n.) ~ The rule in economics that says when the price of a product goes up, the quantity demanded will go down. When the price of a product goes down, the quantity demanded will go up.  需求法则 -Xūqiú fǎzé
  • Market Demand (n.) ~ The total number of products that all buyers require.  Usually shown on a Market Demand Curve demonstrating the relationship between the total quantity demanded and the price.  市场需求- Shìchǎng xūqiú
  • Market Price (n.) ~ The price of a product when it is sold / The price a buyer pays for a product and a seller gets for a product. 市场价格 – Shìchǎng jiàgé
  • Perfect Competition Market (n) ~ A market or industry where there are many buyers and many sellers. All are competing with each other for the best price in a market where there are many substitutes and the products are pretty similar. Companies in these markets have low market power and are usually price-taking. 完美的竞争 – Wánměi de jìngzhēng
  • Seller (n.) ~ Someone who offers a product in exchange for money. The person or company presenting a produce on the market for purchase.  卖家 – Màijiā
  • Total Consumer Surplus (n.) ~ Draw a triangle using the Demand Curve and the Market Price.  Total Consumer Surplus is the area of that triangle.  It is the total savings of all the buyers on the market. See Consumer Surplus.    消费者剩余总额 – Xiāofèi zhě shèngyú zǒng’é

Part #2 ~ What is Consumer Surplus?

The perfect competition 完美的竞争market is a beautiful creature full of amazing trends 趋势and patterns!  In a perfect competition market, buyers and sellers can sometimes trade a product at a better price than they expected (预期). 

Example #1: Timmy is interested in buying a soda (Coca Cola).  Because Timmy is really thirsty, he takes 3¥ and goes to the store to look for a soda.  Although Timmy is willing to pay 3¥ for the soda, he is very happy! He finds a discount 贱卖 where sodas are only 2.80¥ at Walmart.   This means Timmy saved 0.20¥ for his drink! 😊

We call that 0.20¥ a Consumer Surplus (消费者过剩)!  If a buyer pays a price lower than the maximum he was willing to pay, he has a consumer surplus.  By definition: Consumer Surplus is the difference between what the buyer would have paid and what the buyer did pay.

Example #2:  Tara wants to buy a bicycle. She goes to the store and sees that a bicycle is 400¥.  That seems like a good price. She goes home and works and works and works and works. One month later, she has 400¥. She goes to the store again, but now the bicycle is on sale! Discount! The new price is 350¥! 😊 Yay!  She has a Consumer Surplus of 50¥!

Notice: Both the buyer and the seller think the Consumer Surplus is important. For the buyer, the more money they save, the happier they are. The more they save, the more they are willing to buy.  Remember, this market has competition竞争 because there are many buyers and many sellers.  So, if Company A offers the buyer a bigger consumer surplus than Company B—the buyer will shop at Company A.  This is good for the buyer, but bad for Company B.  So Company B will be watching—if Company A has a sale and gives the buyer big savings, Company B will also probably offer a sale in the future also.  We see this all the time—the same product is on sale at 5 different stores. 

Part #3 ~ How to Find Consumer Surplus for One Product?

Consumer Surplus = Economic Value – Market Price

Oh dear. . . . new words.

Let’s start at the beginning.  Economic Value (. 经济价值) is the maximum price the buyer would have paid.  For Timmy, that price for one soda was 3¥.  For Tara, that price for one bicycle was 400¥. 

But in economics 经济学, where do we find this number?  How can you know what the maximum price is that a buyer would have paid?  How do you know how much the buyer was willing to give to the seller?

THE DEMAND CURVE!

The demand curve 需求曲线 is a line that tells us how many products a buyer is willing to buy at a certain price.  It is the price per product

Example: In the picture below:

dEMAND.jpg

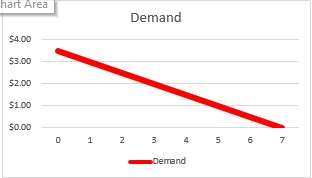
If the price is $3.00, Timmy will buy one soda (that is the maximum price Timmy is willing to pay for Soda #1).  Economic Value for Soda #1 = $3.00

If the price is $2.50, Timmy will buy two sodas (that is the maximum price Timmy is willing to pay for Soda #2). Economic Value for Soda #2 = $2.50

If the price is $1.00, Timmy will buy 5 sodas (that is the maximum price Timmy is willing to pay for Soda #5).  Economic Value for Soda #5 = $1.00

This line shows us an important economic 经济学 rule called the Law of Demand.  This rule says that if the Quantity Demanded is going up, then the price must go down. Each extra soda that Timmy buys is worth a little bit less to him. ☹

So, what is Market Price  (价格)? Market Price is the actual price for the product that the buyer paid.  For Timmy, this price was 2.80¥ for one soda. For Tara, the Market Price was 350¥.  

Demand 2

In the graph above:

            Economic Value for Soda #1 = $3.00

            Market Price for Soda #1 = $1.00

            Consumer Surplus for Soda #1 = $3.00 – $1.00 = $2.00


            Economic Value for Soda #2 = $2.50

            Market Price for Soda #2 = $1.00

            Consumer Surplus for Soda #2 = $2.50 – $1.00 = $1.50

Notice! Important! It is true that if Timmy buys more soda, will save a larger total amount of money.  If he buys only one soda, he just saved $2.00. But if he bought 2 sodas, he would have saved ($2.00 +$1.50 = $3.50). This is why your parents always buy more if something is on sale at the store.  But the savings for each extra soda goes down, down, down. He saves a little bit less for each extra soda he buys.

Here’s the problem — most companies do not just have one buyer (Timmy).  Most companies sell thousands of products to thousands of buyers. Some sell millions of products a day!  

 This is why we don’t always use Economic Value – Market Price. If you only had two products, that might be pretty easy.  But if you have 500,000 products it gets harder and harder to do EV – MP for every single one.

So we have something special called Total Consumer Surplus (消费者剩余总额).  The total consumer surplus is the TOTAL savings for all the buyers. 

To find Total Consumer Surplus, we need to start with a new line called the Market Demand Curve (市场需求). 

Let’s say that we have 3 airplane companies: United Airlines, China Eastern Airlines, and Korean Air. They all want to buy Soda for their airplanes.

  United Airlines China Eastern Korean Air
$0.00 500 550 425
$0.50 400 450 325
$1.00 300 350 225
$1.50 200 250 125
$2.00 100 150 25
$2.50 0 50 0
$3.00 0 0 0

Now we could try to write three demand curves and do a lot of math. 

But much easier is making a new demand curve based on the total number of products all three companies are willing to buy.

$0.00 1475
$0.50 1175
$1.00 875
$1.50 575
$2.00 275
$2.50 50
$3.00 0

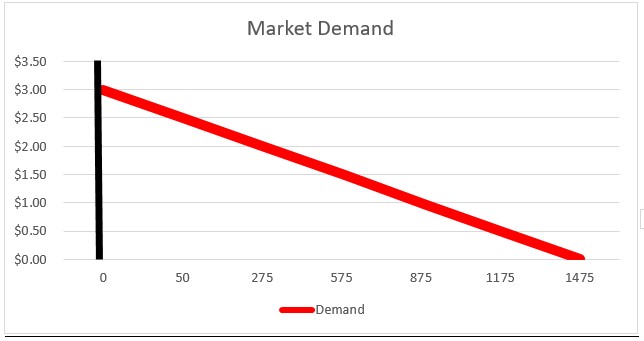
The Market Demand Curve would look like this:

Market Demand 1

Now, we have a “Demand Curve” to work with for Total Consumer Surplus. So let’s start!

Step 1: Market Price.

I say that Market Price was $1.00!  Draw a line showing how many products were purchased at one dollar on our graph.  

Market Demand 2

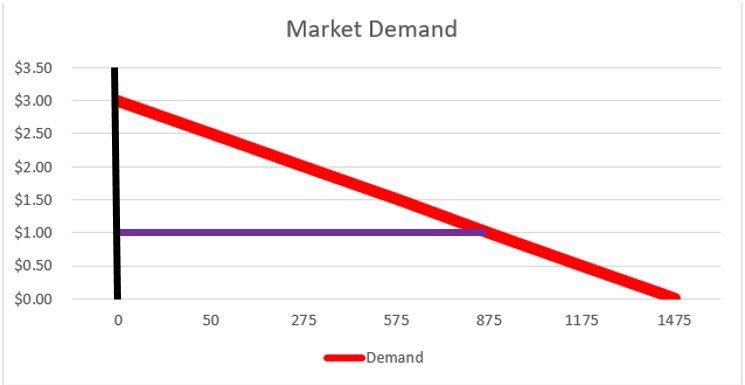
From the purple line, we know that when the price was $1.00 the demand for sodas was 875 bottles for all three companies.

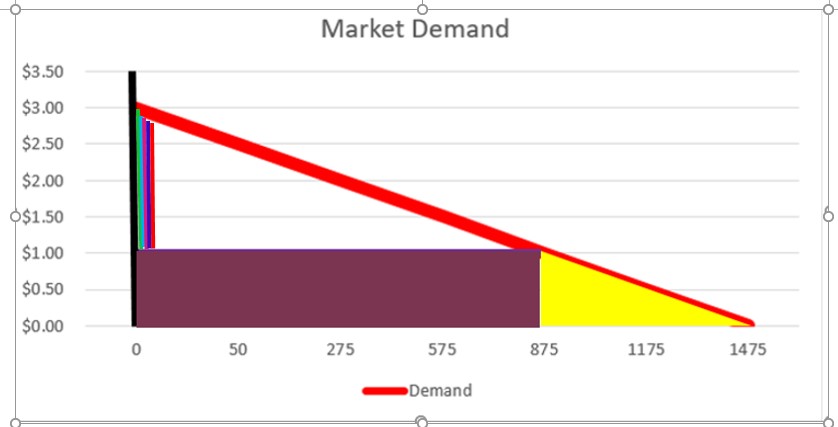
Step 2: Let’s cover up everything after 875 bottles with Yellow Marker . . . . nobody bought those so we won’t count bottles 876 through 1475.  For Consumer Surplus, you can forget about those bottles.

Market Demand 3

Step 3: Now, the Market Price was $1.00 per bottle.  This means they paid $875 to the company.  Let’s fill in everything below the purple line with Purple Marker to show how much money the buyers lost.

Demand.png

Step 4:    Okay. . . . now we can do Consumer Surplus the very, very, very long way.  This means drawing a line from the Economic Value to to the Market Price for every single one of the 875 bottles of soda that we sold.

Market Demand 4

Soda #1 = Economic Value1 – Market Price1
Soda #2 = Economic Value1 – Market Price1
Soda #3 = Economic Value1 – Market Price1
Soda #4 = Economic Value1 – Market Price1
Soda #5 = Economic Value1 – Market Price1

Notice how we just keep coloring in that triangle more and more? If we did all 875 lines, the entire triangle would be colored!

Market Demand 5.jpg

This is why, when we do Total Consumer Surplus, we say you should find the AREA OF A TRIANGLE (一个三角形的区域) instead of adding together all the Economic Value – Market Price that you would have to do.

Demand 33

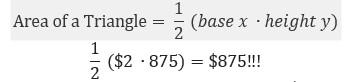
 The total amount of money that the airlines saved was about $875.   So Total Consumer Surplus for the market was $875!

%d bloggers like this: