Archive | Life RSS feed for this section
Image

Garden Mixings

13 May

DSC03146

Sorry, Not Really.

10 May

Looked at my total today after 3 years of paying on it. Yet somehow it still went up. Life sucks!

Image

So Sad, But True

10 May

Does not simply walk into mordor Boromir  - One does not simply have a sallie mae loan And expect it to actually Decrease before death

Night on the town!

10 May

Spent a night out! Yummy food, great friends, peppy music, and fun times abounded. Out til 2am! Boy I’m getting old when that’s exciting. 😛

image

image

image

image

I like numbers 16, 24, and 30. Secret wings, questionable food, and fried son. Sounds delicious!

image

Restaurant makes their own great beer!

Bar Exam Statistics

9 May

Visit my website here to compare Statistics from February 2013 through February 2016

  • Alabama (21.5%) – Fall of 21.4% from Feb. 2015
  • Arkansas –Unknown, Statistics not Shared.
  • Colorado (61%) – Fall of 1% from Feb. 2015
  • Connecticut () – Unknown, Statistics not yet Shared.
  • Florida (58.4%) – Rise of 6.4%
  • Hawaii () – Unknown, Statistics not Shared.
  • Idaho (69.9%) – Steady
  • Illinois – Unknown, Statistics not shared.
  • Indiana (51%) ~ Fall of 16% from Feb. 2015
  • Iowa (61%) – Fall of 11% from Feb. 2016
  • Kansas (50%)Fall of 31.5% from Feb. 2015
  • Kentucky – Unknown, Statistics not yet shared.
  • Louisiana (66.16%) – Rise of 1% from Feb. 2015
  • Maine ~ Unknown, Statistics not yet shared.
  • Maryland (approximately 52.8%) – Rise of 5.8%
  • Massachusetts (50.7%) – Fall of 6% from Feb. 2015
  • Mississippi – Unknown, Statistics not Shared.
  • Missouri (74.3%) – Fall of 3.4% from Feb. 2015
  • Montana (67% including those who have not passed the MPRE, 60% if you don’t include them) – Fall of 7%-14% depending on which number they use from Feb. 2015
  • Nevada (53%) – Fall of 8% from Feb. 2015
  • New Hampshire – Unknown, Statistics not yet shared.
  • New Mexico (69%) – Fall of 11% from Feb. 2015
  • New York (41%) – Fall of 2% from Feb. 2015
  • North Carolina (26% – if you compare applicant list to passing list) – Fall of 17% from Feb. 2015 unless a bunch of people just haven’t taken the MPRE yet (unlikely, but we’ll hope).
  • Ohio (57.2%) – Fall of 6.6% from February 2015
  • Oklahoma (69%) – Rise of 2% from Feb. 2015
  • Oregon (60%) – Fall of 4% from Feb. 2015.
  • Pennsylvania (56.3%) – Rise of 5.7% from Feb. 2015
  • South Carolina (56.18%) – Fall of 7.27% from Feb. 2016
  • Tennessee (51%) – Fall of 3% from Feb. 2015
  • Texas () – Total Unknown.
  • Vermont (61.3%) – Rise of 15.6% from Feb. 2016
  • Viriginia (57.64%) – Fall of 1.5% from Feb. 2016
  • Washington (58.5%) – Fall of 7.2% from Feb. 2015
  • Washington, DC (44%) – Rise of 5%
  • West Virginia (50.4%) – Fall of 17.7% from Feb. 2015

Graduation Approaches!

8 May

My beloved students are abandoning me! Going off to newer and bettter things. Wishing them all the luck and love in the future!

image

image

image

Mother’s Day Lunch!

8 May

Happy Mother’s Day  to the best mom ever!

image

image

MBC Filming Crew!

30 Apr

Cool! Was walking through Seoul yesterday when we passed by the MBC offices near Yeouido Station. Got a chance to see a filming crew in action! Never seen one before, so it was amazing 🙂 He was in handcuffs and was running to jump in a car. Escape! 😛

DSC03001.JPG

Bar Statistics Continued (Again :) )

30 Apr

Visit my website here to compare Statistics from February 2013 through February 2016

  • Alabama (21.5%) – Fall of 21.4% from Feb. 2015
  • Arkansas –Unknown, Statistics not Shared.
  • Florida (58.4%) – Rise of 6.4%
  • Idaho (69.9%) – Steady
  • Illinois – Unknown, Statistics not shared.
  • Indiana (51%) ~ Fall of 16% from Feb. 2015
  • Iowa (61%) – Fall of 11% from Feb. 2016
  • Kansas (50%)Fall of 31.5% from Feb. 2015
  • Kentucky – Unknown, Statistics not yet shared.
  • Louisiana (66.16%) – Rise of 1% from Feb. 2015
  • Maine ~ Unknown, Statistics not yet shared.
  • Massachusetts (50.7%) – Fall of 6% from Feb. 2015
  • Mississippi – Unknown, Statistics not Shared.
  • Missouri (74.3%) – Fall of 3.4% from Feb. 2015
  • Montana (67% including those who have not passed the MPRE, 60% if you don’t include them) – Fall of 7%-14% depending on which number they use from Feb. 2015
  • New Hampshire – Unknown, Statistics not yet shared.
  • New Mexico (69%) – Fall of 11% from Feb. 2015
  • New York (41%) – Fall of 2% from Feb. 2015
  • North Carolina (26% – if you compare applicant list to passing list) – Fall of 17% from Feb. 2015 unless a bunch of people just haven’t taken the MPRE yet (unlikely, but we’ll hope).
  • Ohio (57.2%) – Fall of 6.6% from February 2015
  • Oklahoma (69%) – Rise of 2% from Feb. 2015
  • Oregon (60%) – Fall of 4% from Feb. 2015.
  • Pennsylvania (56.3%) – Rise of 5.7% from Feb. 2015
  • South Carolina (56.18%) – Fall of 7.27% from Feb. 2016
  • Tennessee (51%) – Fall of 3% from Feb. 2015
  • Vermont (61.3%) – Rise of 15.6% from Feb. 2016
  • Washington (58.5%) – Fall of 7.2% from Feb. 2015
  • West Virginia (50.4%) – Fall of 17.7% from Feb. 2015
  • Viriginia (57.64%) – Fall of 1.5% from Feb. 2016

Corporate Finance – What is the Balance Sheet?

27 Apr

**As always, my work is designed with Chinese ESL student in mind. Please consider this when reading.

Corporate Finance has 3 main types of Financial Documents:

  • Balance Sheet ~ Value of the Company (How it is divided between Debt and Equity)
  • Income Statement ~ Specific Use of Assets and Liabilities
  • Cash Flow Statement ~ How Cash is Handled from the moment it enters the company until it leaves.
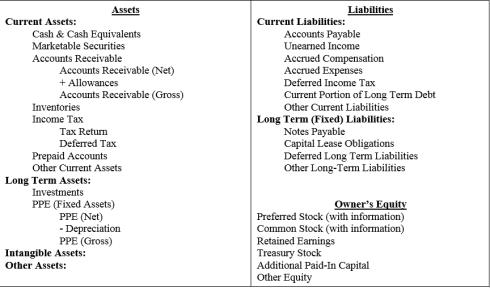
Balance Sheet

We all know that Revenue has to be bigger than Costs/Expenses if the company is going to be successful (Revenue – Cost = Profit). And if you are a financial manager, your legal responsibility is to increase profits for the Shareholders (earn a profit). 

However, for years all that companies worked with were Income Statements. Unfortunately many of them quickly realized they could hide money away in methods not put on the Income Statement. Not only that, but the Income Statement didn’t really outline all of the important factors used in looking at Profit.  So now we have the Balance Sheet -a financial document intended to make everything more honest and clear.

The Balance Sheet summarizes the Assets, Liabilities, and Equity at a certain date.

  •    It is an overall summary of what the company looks like. 
  •   It explains to the Business how well the company is functioning
  •   It explains to Owners how well their Equity is doing
  •   In general, it tells us if the company will be profitable or not.

For example, how much is the company worth July 2016?

General Equation (Assets = Equity – Liabilities)

  • Assets = Everything owned by the company.  Obtained by either creating capital or obtaining debts (borrowing money)
    • Current Assets –Assets that will be turned into cash within 1 Year
    • Long-Term (Fixed) Assets – Assets that will be turned into cash within more than 1 Year
    • Intangible Assets – Assets that you cannot see, but that still exist
  • Liabilities = All the debt the company has to pay
    • Current Liabilities—Debts to be paid this year.
    • Long-Term Liabilities—Debts to be paid in more than 1 year.
  • Equity (Net Worth) = Assets – Liabilities (The Company’s Value for the owners)
    • Owner’s Equity (Owner’s Investment – Owner’s Withdrawals from the Company +/- Net Income/Loss)
    • Retained Earnings
    • Net Profits or Losses


The Balance Sheet will be organized according to the “Liquidity” of the category (meaning how quickly that category of assets, liabilities, or equity can be changed into cash). The farther down the list we go, the less liquid the categories become.

EXAMPLE

Assets